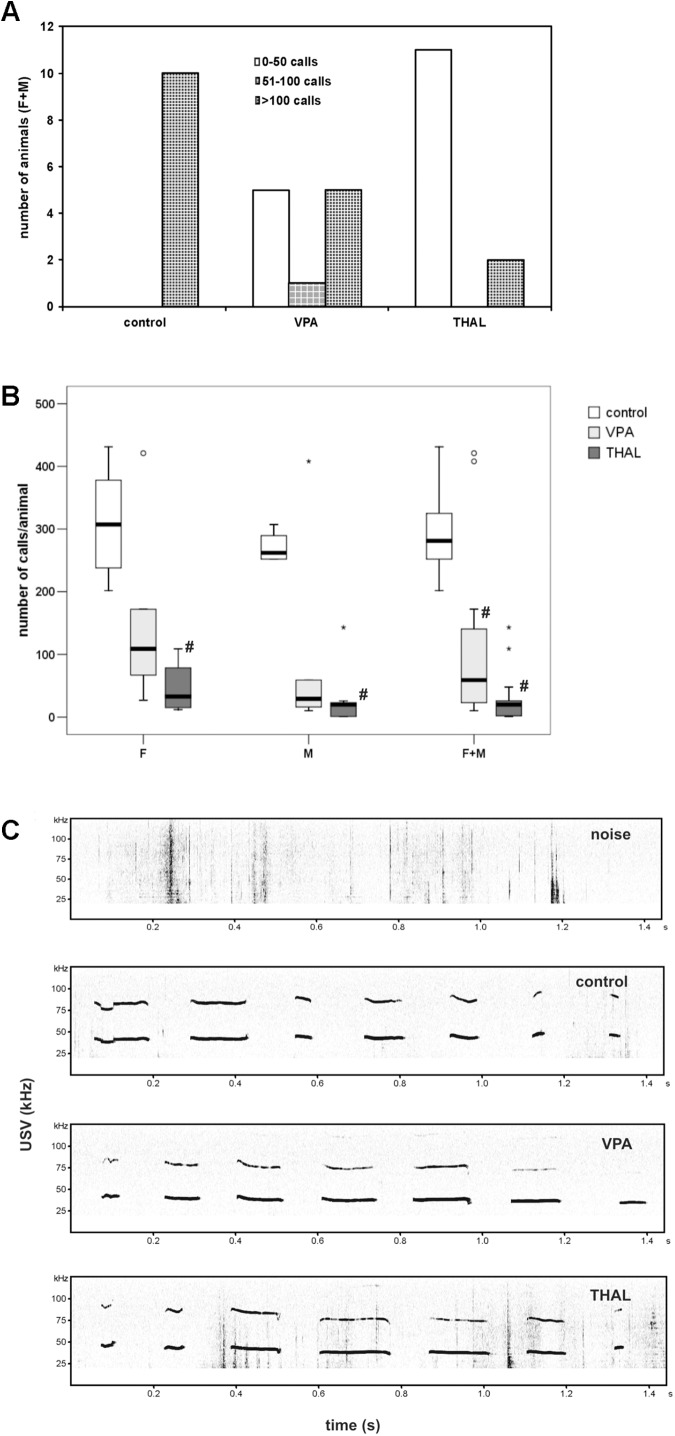
FIGURE 4.
(A) The number of vocalizing animals for each study (control, VPA, THAL) group, each separated into three subgroups according to the number of calls emitted; subgroup 1: 0–50 calls; subgroup 2: 51–100; subgroup 3: above 100. VPA, rat pups in group treated with valproic acid; THAL, treated with thalidomide, all treated during fetal development; F, female; M, male animals. (B) Box and Whiskers plot of number of calls per animal obtained from ultrasonic vocalization test expressed as a median (min-max) value. Number of rat pups: n = 10 (control), n = 11 (VPA) and n = 13 (THAL); # represents results statistically significant vs. control, p < 0.05, one-way ANOVA followed by Dunn’s correction; box containing 50% of results that fell in the range between 25% (bottom line) and 75% (top line), ( ) median value,
  – outlier point per rat, ∗ – extreme outlier point per rat. (C) The example of spectrograms of USV from each group.

