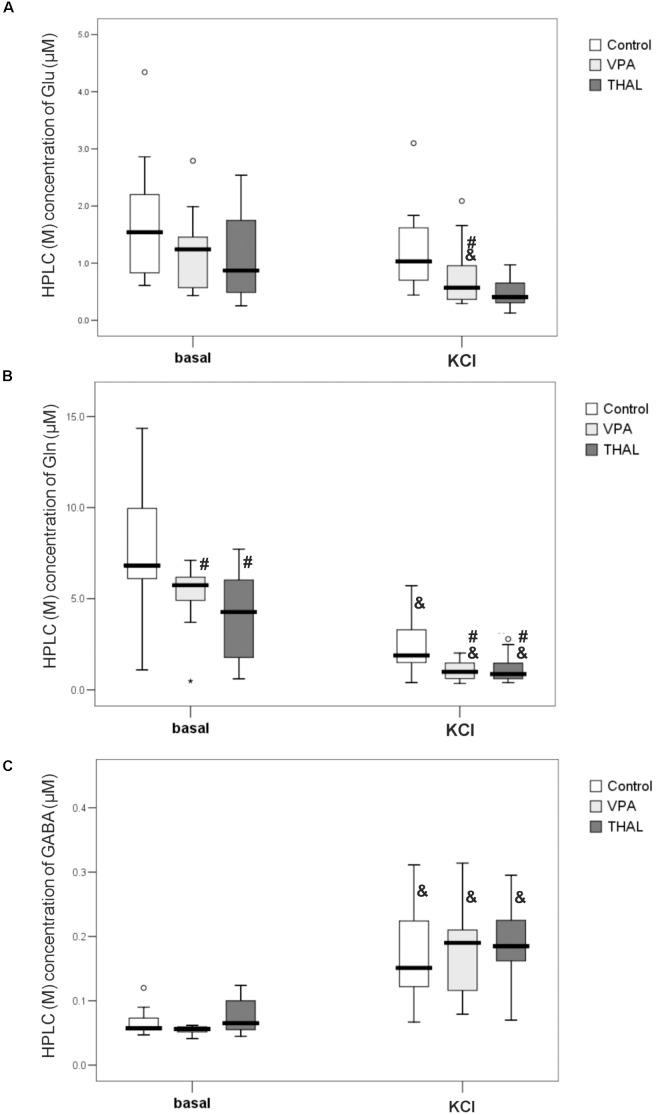
FIGURE 6.
Box and Whiskers plot of concentration of Glu (A), Gln (B) and GABA (C) in microdialysates of rat hippocampus collected at basal level and at 40 min post application of 100 mM KCl (KCl) measured using HPLC method. Results are presented as median (min÷max) values of tested amino acid concentration in μM. Results that are statistically significant vs. control represented by # and vs. basal level by &, p < 0.05. Number of rat pups: n = 10 (control), n = 11 (VPA) and n = 13 (THAL); # represents results statistically significant vs. control, p < 0.05, one-way ANOVA followed by Dunn’s correction; box containing 50% of results that fell in the range between 25% (bottom line) and 75% (top line), ( ) median value,
  – outlier point per rat, ∗ – extreme outlier point per rat.

