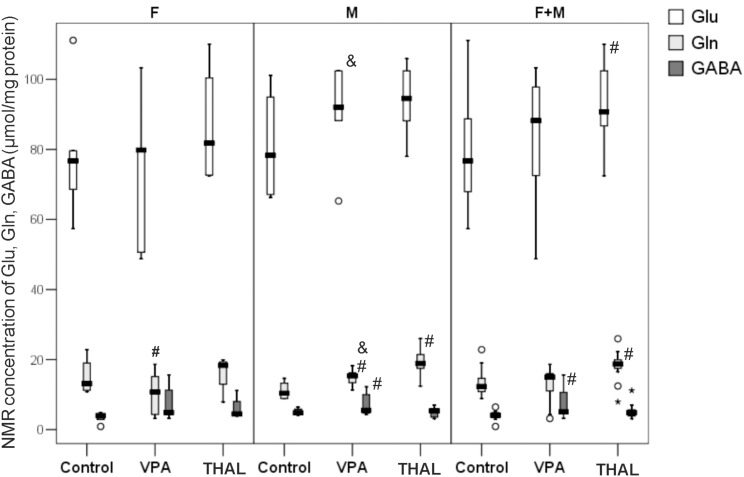
FIGURE 8.
Box and Whiskers plot of total Glu, Gln, and GABA concentrations of rat hippocampus homogenates measured using NMR method. Results are presented as median (min-max) values of tested amino acids level. Differences statistically significant vs. control are represented by # and within a group between genders by &, p < 0.05. Number of rat pups: n = 10 (control), n = 11 (VPA), and n = 13 (THAL); # represents results statistically significant vs. control, p < 0.05, one-way ANOVA followed by Dunn’s correction; box containing 50% of results that fell in the range between 25% (bottom line) and 75% (top line), ( ) median value,
  – outlier point per rat, ∗ – extreme outlier point per rat.

