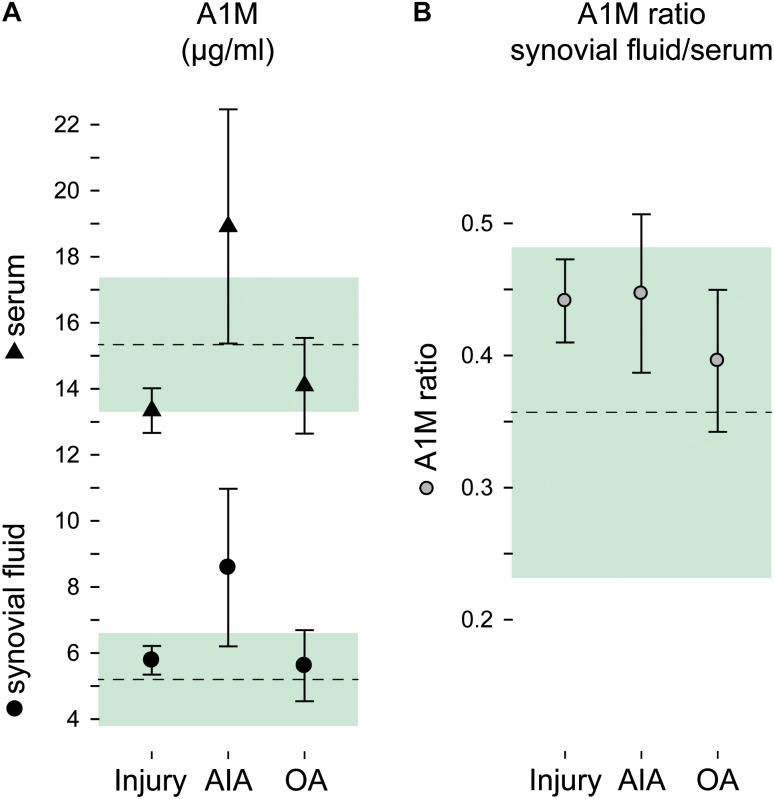
FIGURE 1.
A1M by diagnostic groups. Concentrations of A1M in (A) synovial fluid and serum and (B) as a ratio in concentrations synovial fluid to serum. Group means and 95% confidence intervals are plotted as circles and triangles with error bars for the injury, acute inflammatory arthritis (AIA) and osteoarthritis (OA) groups, and as a dashed line and green area for the reference group. (Plotted data and statistics are reported in full in Supplementary Table S1).

