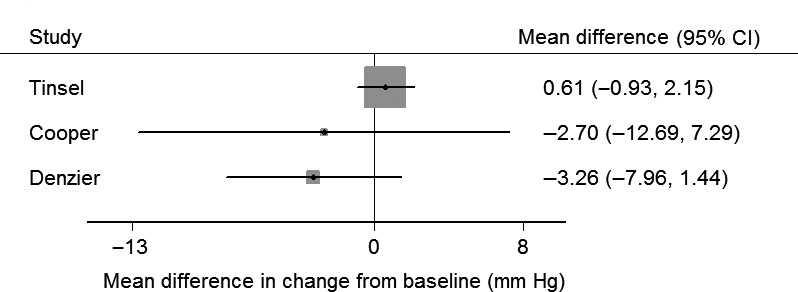
Figure 5.

Change in systolic blood pressure at 1 y. Forest plot of the mean difference in change from baseline of systolic blood pressure (mmHg), between intervention and control. Tinsel: results adjusted for baseline values of outcomes. Cooper: no adjustment reported. Deinzer: no adjustment reported
