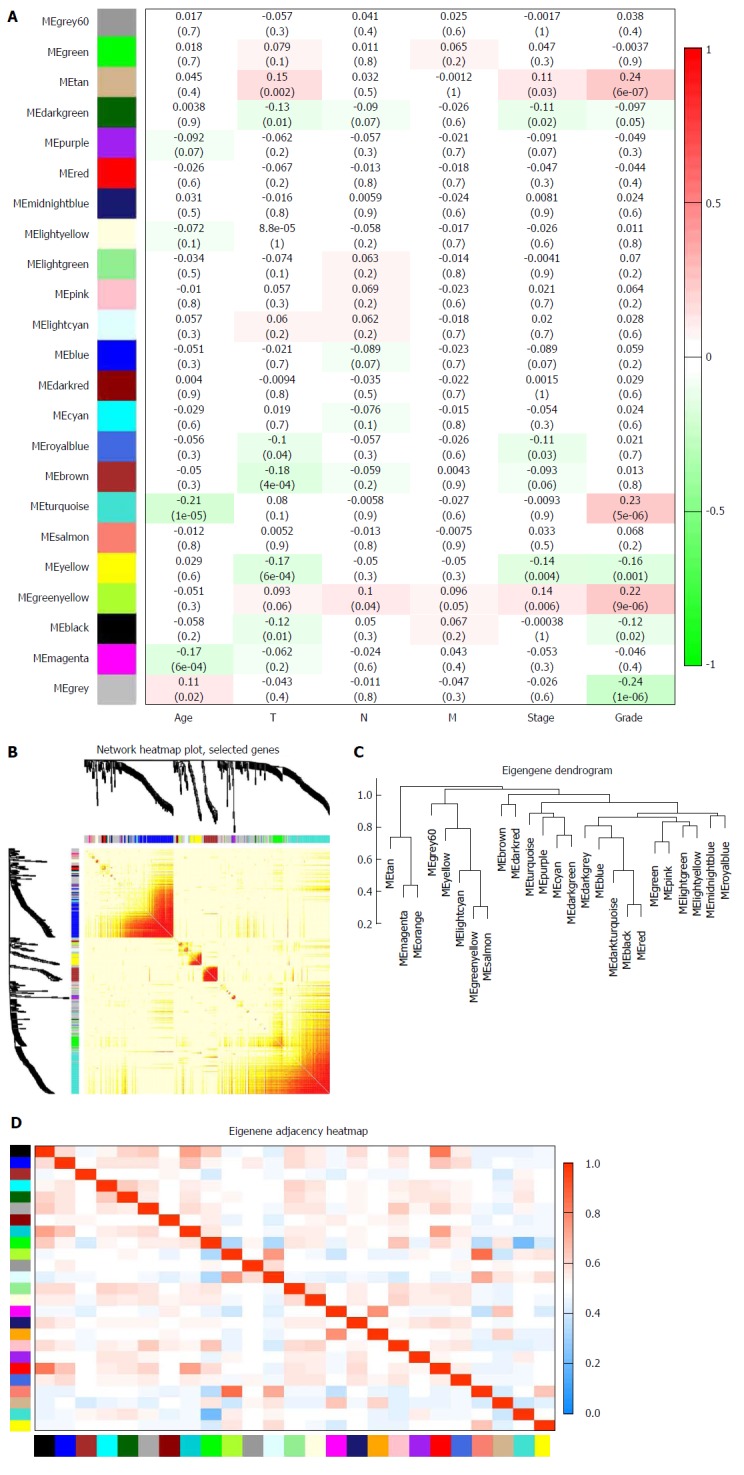
Figure 3.

Identification of modules associated with clinical traits of stomach adenocarcinoma. A: Heat map of the correlation between module eigengenes and clinical traits of stomach adenocarcinoma (SA); B: Topological overlap matrix (TOM) plot; C: Visualization of hierarchical clustering dendrogram of the eigengenes. The eigen gene network represents the relationships among modules; D: Heat map of the eigengene adjacency. The color bars on the left and below indicate the module for each row or column.
