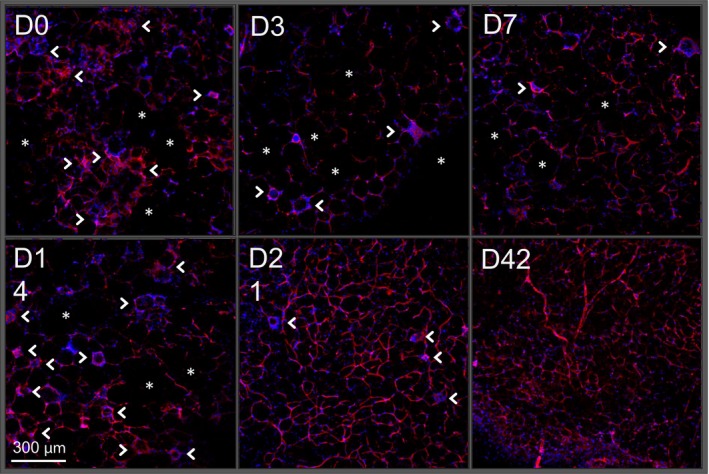
Figure 5.

Architectural transformation of adipose vasculature during dietary weight loss. Visualization of adipose vascular network by CD31 immunohistochemistry (red) beginning at the height of weight gain (D0) and continuing through the course of diet‐induced weight loss (D3‐D42). Nuclei are stained with DAPI (blue). Asterisks = areas devoid of vasculature. Arrowheads = crown‐like structures. Images are representative of 4–5 mice/group.
