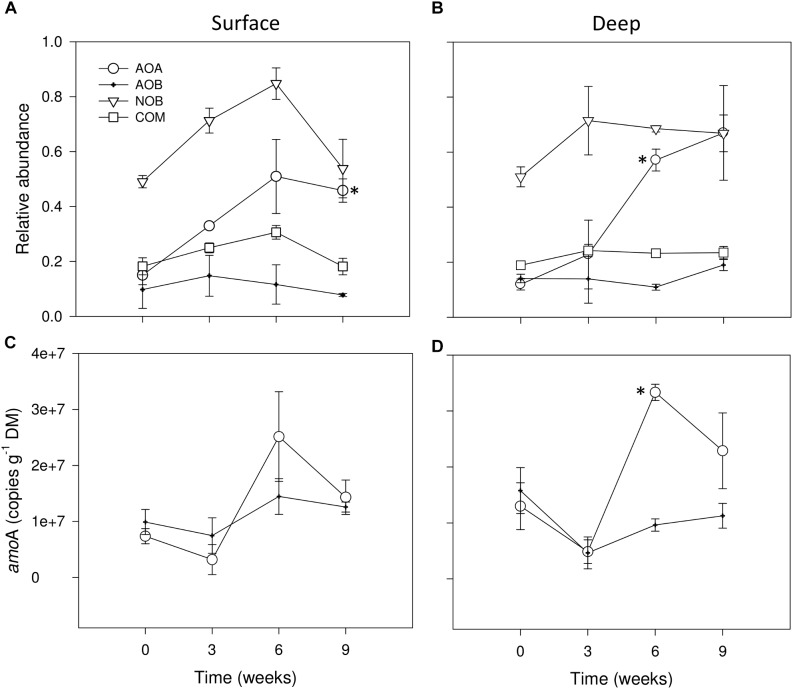
FIGURE 4.
Relative abundances (%) of 16S rRNA sequence tags from AOA, AOB, NOB and COMAMMOX groups in surface (A) and deep sediments (B) during initial conditions (i.e., 0 weeks) and after the different DPDs with no rainfall (i.e., 0 mm selected). Number of copies of amoA genes for AOA and AOB in surface (C) and deep sediments (D) during initial conditions and after the different DPDs with no rainfall. Asterisks (∗) denote significant (P ≤ 0.05) differences to initial wet conditions after Student’s t-test followed by Holm’s correction for multiple comparisons. Values are means ± SE (n = 3).

