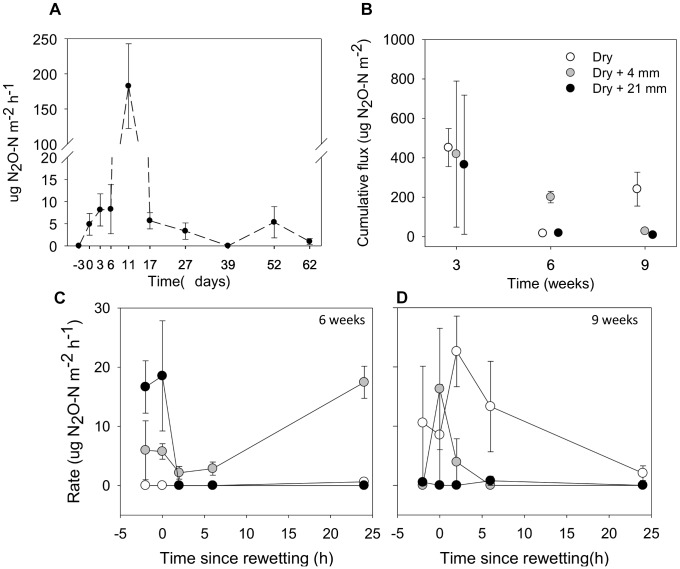
FIGURE 6.
(A) Fluxes of N2O from sediments before microcosms drainage (microcosms with a surface water column; t = –3 days), immediately after drainage (t = 0 days) and several times after drainage and drying. (B) Accumulated fluxes of N2O following 24 h under the effects of variable RMs (0, 4, and 21 mm) after the different DPDs. (C) and (D) Fluxes of N2O before (t = –2 h), immediately (t = 0 h) and following rainfall events (t = 2, 6, and 24 h) after 6 and 9 weeks of drying, respectively. Values are means ± SE (n = 3).

