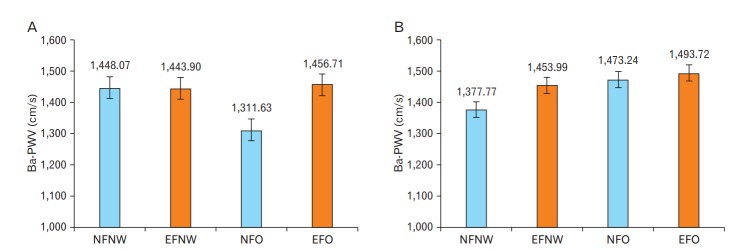
Figure. 1.
Ba-PWV according to combined BMI and BF groups after adjusting for multiple variables. Blue bars represent the normal pBF groups and red bars represent the excessive pBF groups. (A) Ba-PWV according to combined BMI and BF groups in males (P=0.015). (B) Ba-PWV according to combined BMI and BF groups in females (P=0.040). P-values were calculated using an analysis of covariance. Ba-PWV, brachial-ankle pulse wave velocity; BMI, body mass index; BF, body fat; pBF, body fat percentage; NFNW, normal fat and normal weight; EFNW, excessive fat and normal weight; NFO, normal fat and obese; EFO, excessive fat and obese.

