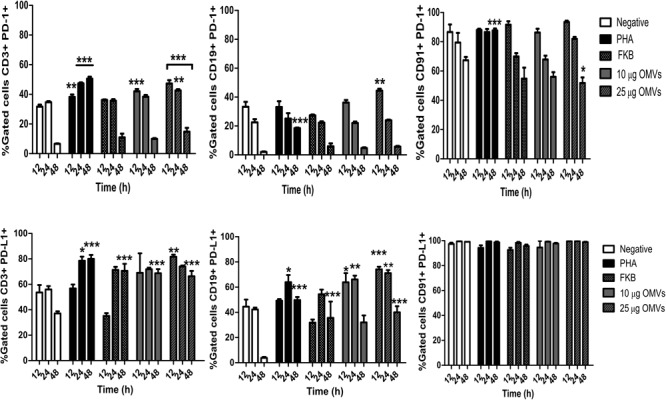
FIGURE 4.

Analysis of expression of inhibition surface markers in PBMCs stimulated with A. hydrophila ATCC® 7966TM OMVs. PBMCs from healthy donor were co-cultured with OMVs from A. hydrophila. Inhibition was measured by flow cytometry using mAbs against surface molecules (PD-1, PD-L1). Monocyte (CD91+) and lymphocytes (CD3+, CD19+) were gated to analyze individually the expression of surface molecules. FKB were used as control for the expression of surface markers. ∗P < 0.05, ∗∗P < 0.01, ∗∗∗P < 0.001.
