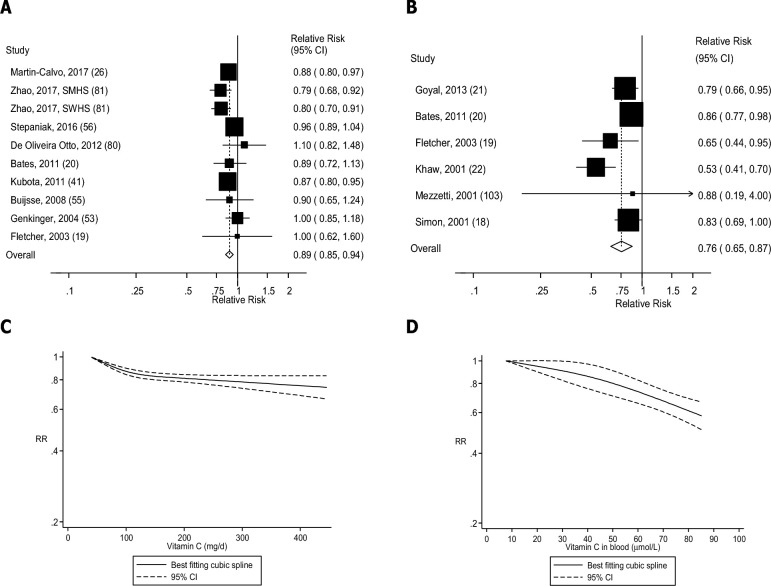
FIGURE 4.
Dietary intake and blood concentrations of vitamin C and cardiovascular disease: dose-response analyses. (A) Dietary vitamin C and cardiovascular disease: linear dose-response analysis. The summary RR per 100 mg/d was 0.89 (95% CI: 0.85, 0.94, I2 = 27%, Pheterogeneity = 0.19, n = 10). (B) Vitamin C in blood and cardiovascular disease: linear dose-response analysis. The summary RR per 50 µmol/L was 0.76 (95% CI: 0.65, 0.87, I2 = 56%, Pheterogeneity = 0.05, n = 6). (C) Dietary vitamin C and cardiovascular disease: nonlinear dose-response analysis. There was evidence of nonlinearity between dietary vitamin C and cardiovascular disease (Pnonlinearity < 0.0001). (D) Vitamin C in blood and cardiovascular disease: nonlinear dose-response analysis. There was no evidence of nonlinearity for vitamin C in blood and cardiovascular disease (Pnonlinearity = 0.26). Summary RRs and 95% CIs were calculated with the use of random-effects models, and the nonlinear dose-response analyses were conducted with the use of restricted cubic splines. SMHS, Shanghai Men's Health Study; SWHS, Shanghai Women's Health Study.

