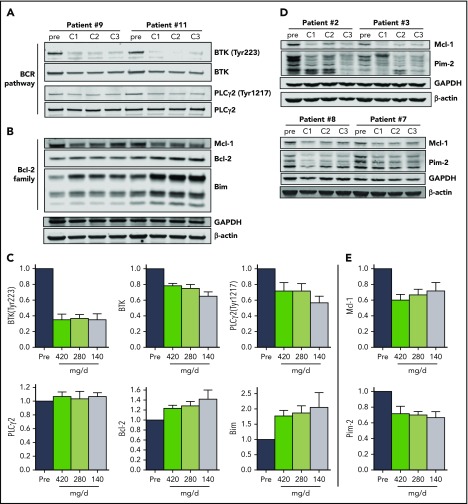
Figure 3.
The effect of ibrutinib on BCR pathway and Bcl-2 family proteins during 3 doses of ibrutinib. Immunoblot analyses of (A) BCR pathway proteins and (B) Bcl-2 family proteins in CLL cells from patients 9 and 11 on D28 of each cycle. (C) Mean levels (n = 6) of the proteins shown in (A) and (B) normalized to both β-actin and glyceraldehyde-3-phosphate dehydrogenase (GAPDH) averaged and then expressed relative to pretreatment levels. The data are the means of the 2 values; error bars represent SEMs. (D) Immunoblot analyses of early-response gene proteins. Note: the images of these immunoblots are from the same gels shown in supplemental Figure 4A; thus, the GAPDH and β-actin loading controls are the same. (E) Mean levels (n = 4) of the proteins shown in (D) normalized to both β-actin and GAPDH averaged and then expressed relative to pretreatment levels. The data are the means of the two values; error bars represent SEMs.

