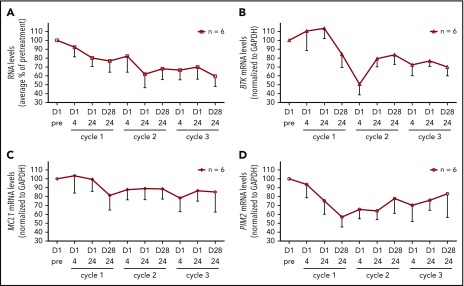
Figure 5.
Effect of ibrutinib treatment on total RNA and specific mRNA transcript levels during dose reductions over the course of 3 cycles. (A) Total RNA levels in CLL cells from patients (n = 6) during therapy and normalized by cell number. The RNA levels are expressed as percentages of pretreatment RNA levels in CLL cells before the start of therapy in the same patient ± SEMs. (B-D) Transcript levels of (B) BTK, (C) MCL-1, and (D) PIM2 were measured using real-time reverse transcription polymerase chain reaction and normalized using GAPDH as an internal standard. The results are expressed as percentages of the gene expression levels in CLL cells from patients (n = 6) before the start of therapy and represent the means of triplicate experiments for each patient ± SEMs.

