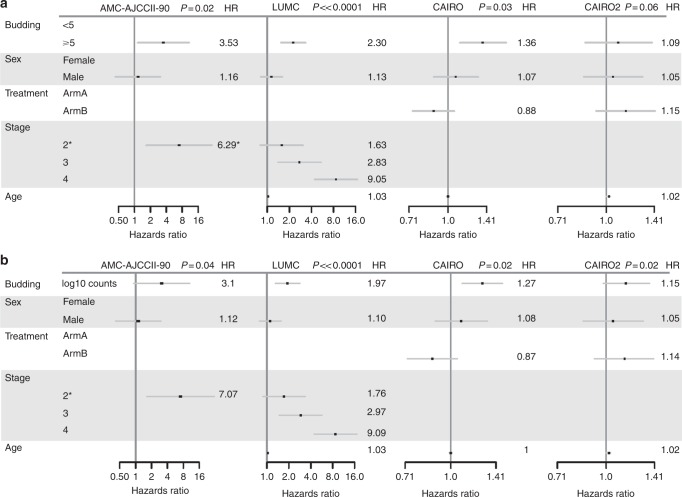
Fig. 3.
Forest plots showing hazard ratios (HR) and 95% confidence intervals from multivariable Cox regression analysis across all cohorts using tumour budding as a a threshold of 5 buds and b as a continuous variable. Note the AMC-AJCCII-90 analysis compares the effects for stage 2A (reference level) and 2B

