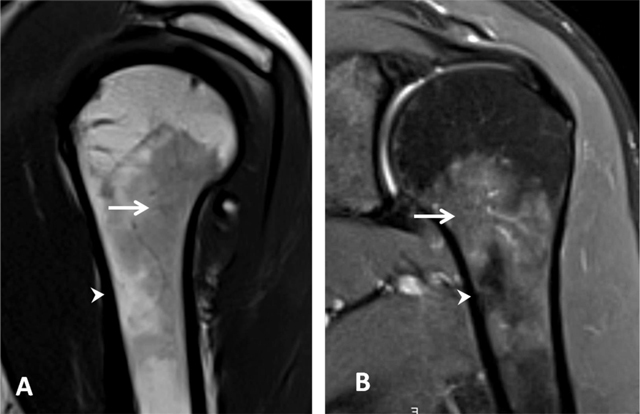
Figure 2.

Normal red bone marrow in a young adult. (A) Sagittal oblique T1-weighted and (B) Coronal oblique fat-suppressed PD-weighted MR images detect areas of red marrow in the proximal humeral diaphysis with low signal intensity on T1 (arrow, A) and increased signal on fat-suppressed PD (arrow, B). This is usually observed bilaterally and without epiphyseal involvement. Cortical bone has a low signal intensity on both sequences (arrowhead, A and B).
