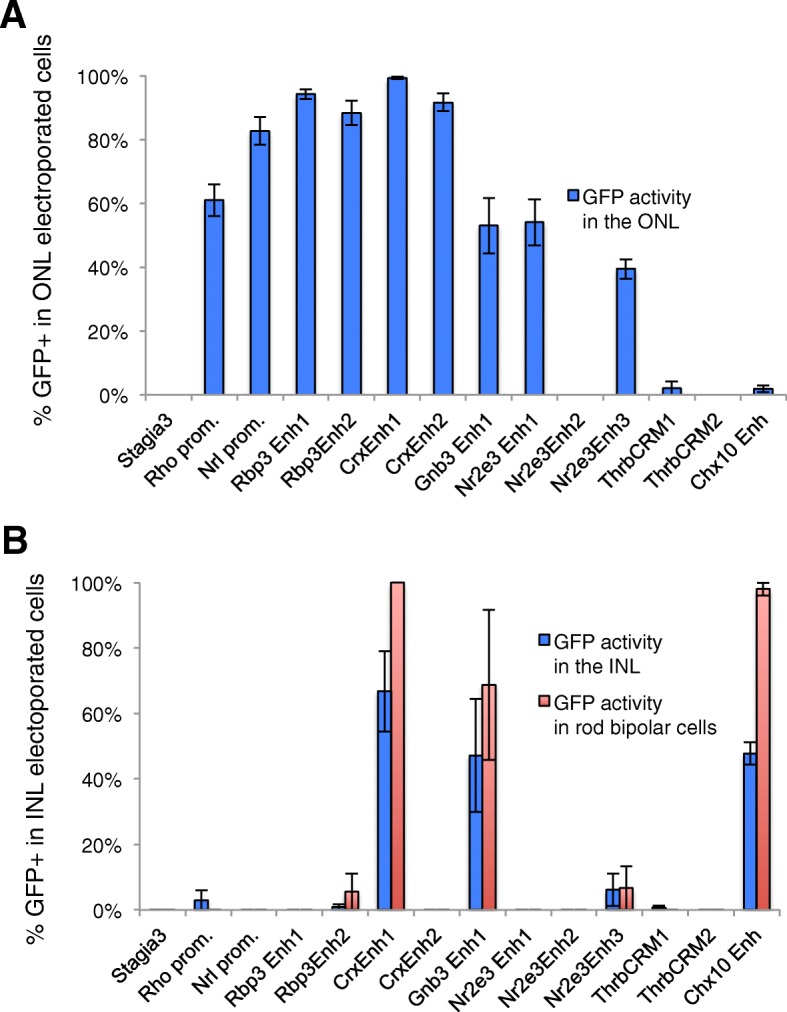
Fig. 4.

Quantitation of reporter activity in the mouse postnatal retina. Fluorescent cells from confocal images as shown in Fig. 3 were quantified using ImageJ. All electroporated cells (either β-gal-positive or GFP-positive) were identified and categorized as having their cell body located in either the ONL or the INL. For those cells located in the INL, cells were also examined for expression of PKCalpha, a rod bipolar marker. a The percentage of GFP-positive cells out of all electroporated cells is plotted with blue bars. b The percentage of GFP-positive cells out of all electroporated cells in the INL is plotted with blue bars. The percentage of GFP-positive cells that were identified as rod bipolar cells is shown with red bars
