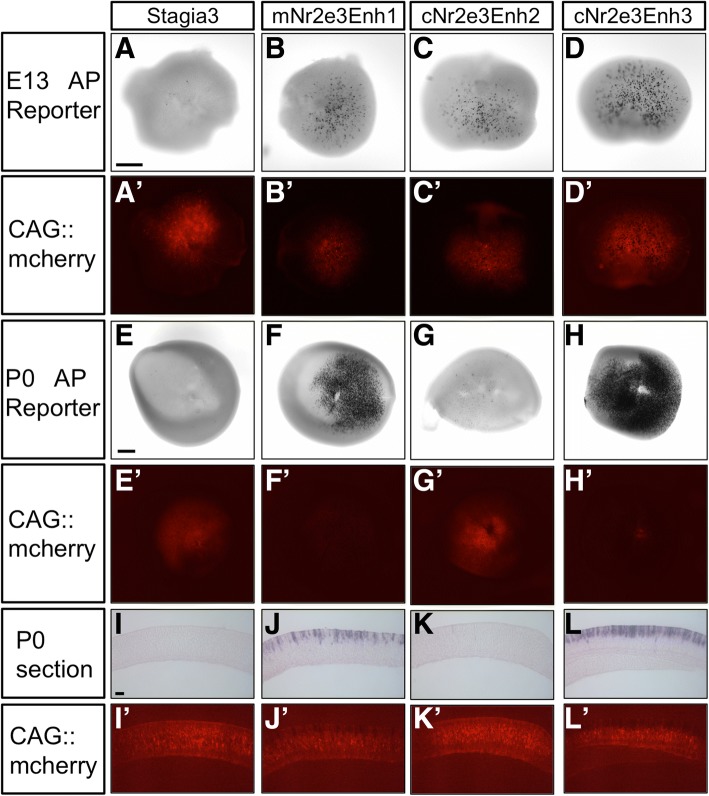
Fig. 8.
Activity of Nr2e3 cis-regulatory elements in mouse retinas. (A-D) Co-electroporation of one of the Nr2e3 elements driving an AP reporter or the control Stagia3 vector with CAG::mCherry (signal shown in A’-D’) to confirm electroporation in E13 mouse retinas. (E-H) Same DNA constructs as in A-D, but using P0 mouse retinas.(E’-H’) CAG::mCherry signal from retinas shown in E-H. (I-L) Sections of P0 retinas shown in E-H showing location of AP reporter-positive cells. (I’-L’) CAG::mCherry signal of sections shown in I-L. Scale bar in A is 100um and applies to A-D and A’-D’. Scale bar in E is 200 μm and applies to E-H and E’-H’. Scale bar in I is 20 μm and applies to I-L and I’-L’

