Fig. 1.

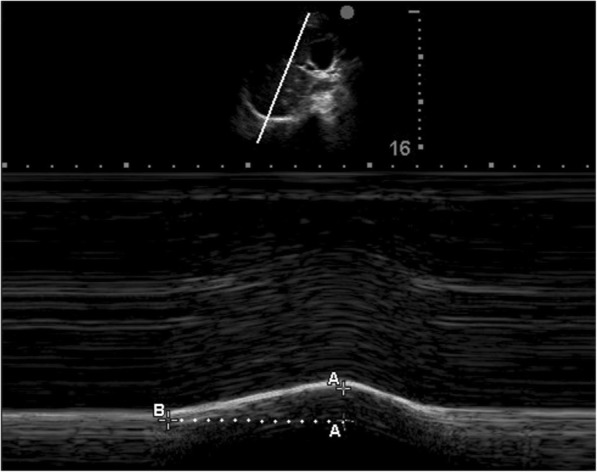
Image showing measurement of the diaphragmatic inspiratory excursion and TPIAdia in M-mode ultrasound. The A-A is the height of diaphragmatic inspiratory excursion. The B-A is the TPIAdia. TPIAdia, time to peak inspiratory amplitude

Image showing measurement of the diaphragmatic inspiratory excursion and TPIAdia in M-mode ultrasound. The A-A is the height of diaphragmatic inspiratory excursion. The B-A is the TPIAdia. TPIAdia, time to peak inspiratory amplitude