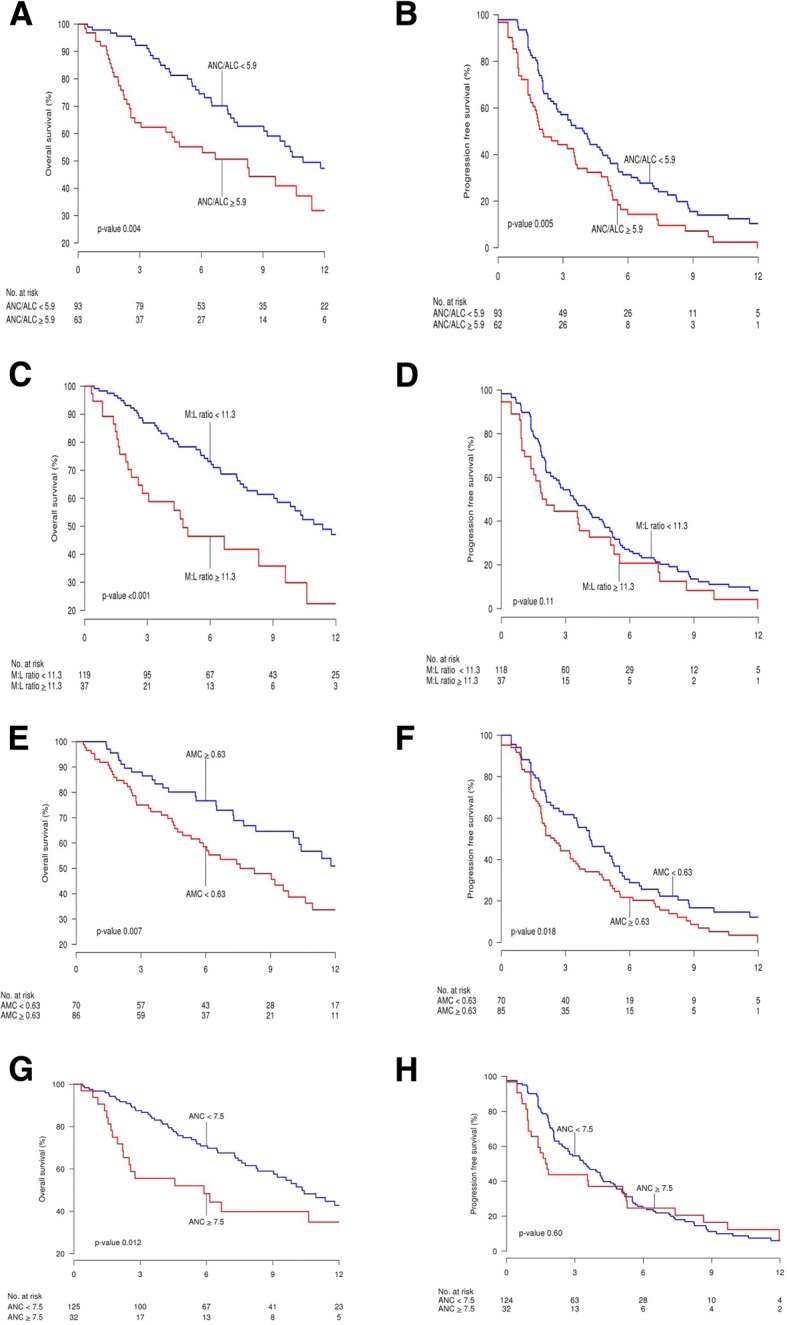
Fig. 1.

Kaplan-Meier Survival Curves for Overall Survival (OS; a, c, e, g) and Progression-Free Survival (PFS; b, d, f, h) of Non-Small Cell Lung Cancer Patients Treated With Anti-PD-1 Antibodies. Time is represented in months from start date of immunotherapy. a and b, patients are stratified by absolute neutrophil to lymphocyte (ANC:ALC) ratio. Blue lines represent ANC:ALC ratio < 5.9 and red lines, ANC:ALC ratio ≥ 5.9. c and d, patients are stratified by myeloid to lymphoid (M:L) ratio. Blue lines represent M:L ratio < 11.3 and red lines, M:L ratio ≥ 11.3. e and f, patients are stratified by absolute monocyte count (AMC). Blue lines represent AMC < 0.63 × 10⁹/L and red lines, AMC ≥ 0.63 × 10⁹/L. g and h, patients are stratified by absolute neutrophil count (ANC). Blue lines represent ANC < 7.5 × 10⁹/L and red lines, ANC ≥ 7.5 × 10⁹/L
