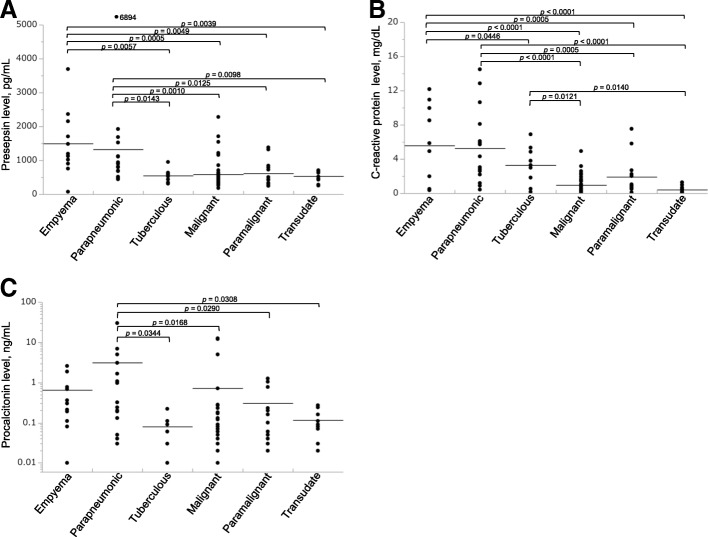
Fig. 1.
Pleural fluid presepsin, CRP, and PCT levels. (a–c) Pleural fluid presepsin (a), CRP (b), and PCT (c) levels in the different diagnostic subgroups. Individual values are plotted. Bars represent the means of the values, and p-values are shown between only groups with statistically significant differences

