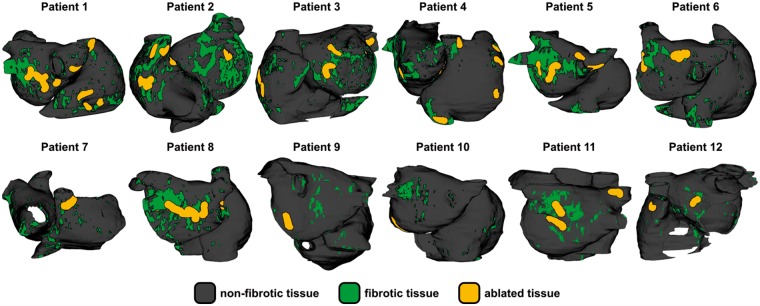
Figure 1.
Distribution of fibrotic tissue and locations of ablated RDs in all 12 patient-specific atrial models. Ablated tissue regions correspond to RD trajectories observed under EPavg condition in previous study by Deng et al.14 EPavg, average AF electrophysiology; RD, re-entrant driver.

