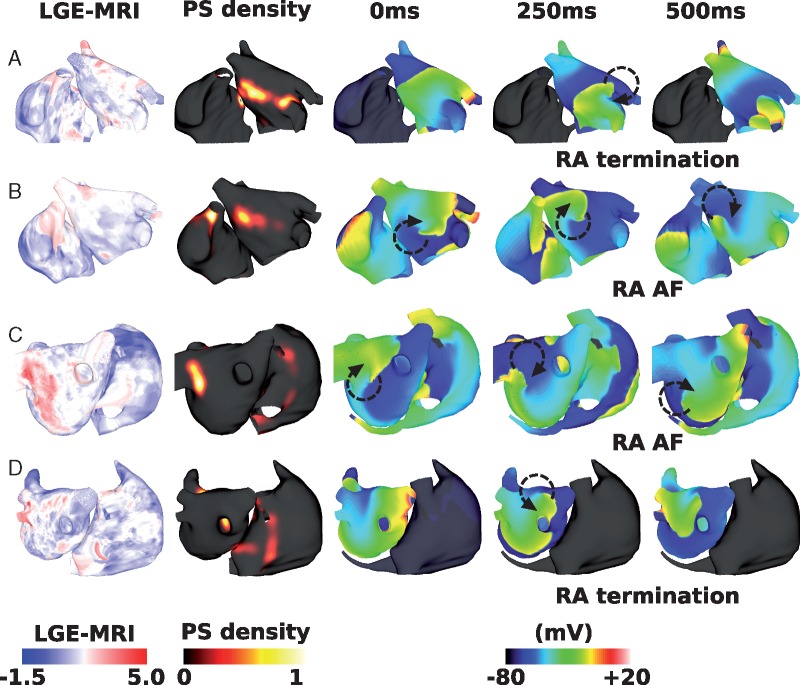
Figure 5.
Effects of interstitial fibrosis on IAC ablation. Plots show LGE-MRI distributions, PS density distributions measured pre-IAC ablation, and transmembrane potential maps measured at three time points post-IAC ablation. (A) An example success, in which RA arrhythmia terminates. (B) An example failure, as RA arrhythmia sustains post-total IAC ablation. (C) An example failure. (D) An example success, as RA arrhythmia terminates. (A) and (B) are shown in anteroposterior view; (C) and (D) are shown in posteroanterior view. AF, atrial fibrillation; IAC, interatrial connections; LGE-MRI, late gadolinium enhancement magnetic resonance imaging; PS, phase singularity; RA, right atrium.

