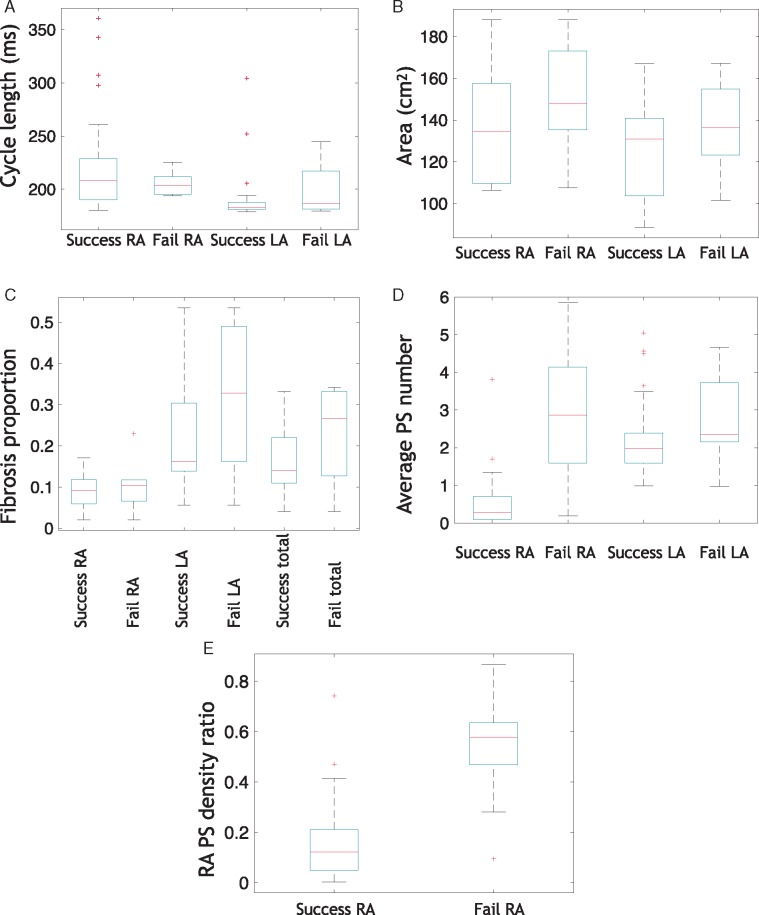
Figure 7.
RA PS density ratio predicts IAC ablation outcome. Cases are classified as success or fail depending on whether RA arrhythmia terminates post-IAC ablation, and mean properties calculated for each of the LA and RA. (A) Average CL in the RA and LA, (B) average area, (C) proportion of the RA, LA, and total tissue assigned as fibrotic, (D) Average number of PSs in the RA and LA at a given time instance (means significantly different under unpaired t-test, with P < 0.0001 for the RA and P = 0.04 for the LA), (E) RA PS density ratio (means significantly different under unpaired t-test, with P < 0.0001). Boxes indicate 25th and 75th percentiles, the red lines indicate median locations, and crosses represent outliers. AF, atrial fibrillation; CL, cycle length; IAC, interatrial connections; LA, left atrium; PS, phase singularity; RA, right atrium.

