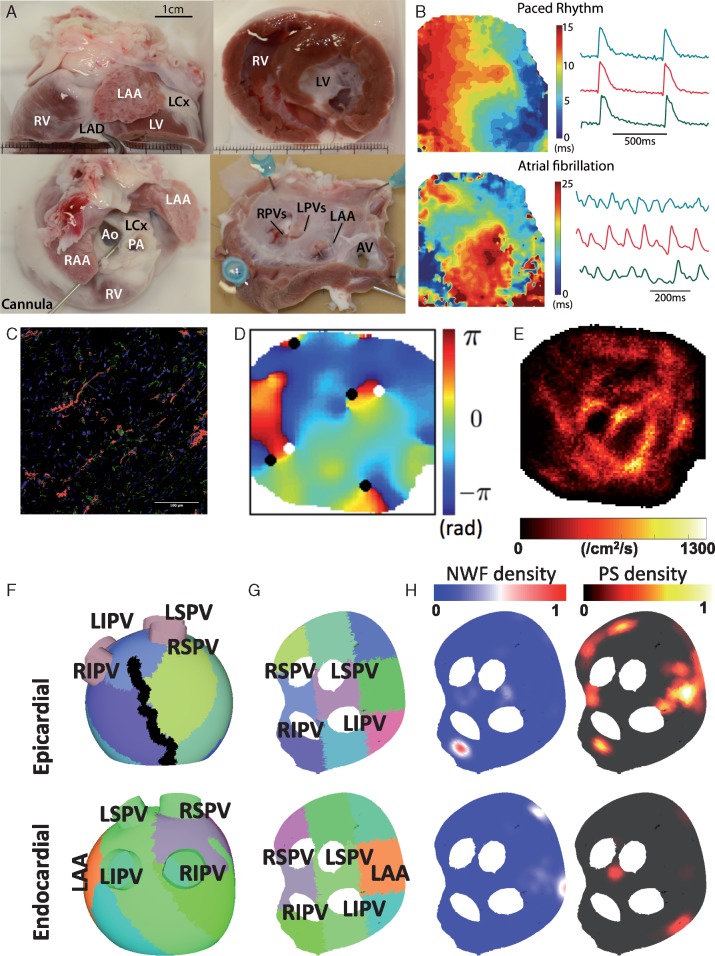
Figure 2.
Experimental and computational model set-up. (A) Experimental preparation—canine hearts donated by collaborators were dissected and the isolated left atrium perfused via the circumflex artery for left atrial endocardial optical mapping. (B) Examples of activation maps and optical action potentials during pacing and in AF for this experimental set-up, generated using the Rhythm GUI.13 (C) Areas of fibrosis quantified using autofluorescence (red). (D) Phase map showing phase singularities (black and white circles, depending on chirality). (E) PS density map. (F) Computational mesh used for simulations divided into nine regions to correspond with experimental sections used for histomorphometry and immunohistochemistry. An ablation line corresponding to the location used to open the tissue for endocardial optical mapping is also marked in black. The LAA location is also marked for comparison with B. (G) The mesh is flattened for visualization purposes, in the same way as the experimental preparation. (H) Example NWF density and PS density maps. AF, atrial fibrillation; Ao, aorta; AV, aortic valve; LAA, left atrial appendage; LAD, left anterior descending artery; LCX, left circumflex artery; LIPV, left inferior PV; LV, left ventricle; LPVs, left pulmonary veins; LSPV, left superior PV; PA, pulmonary artery; PS, phase singularity; PV, pulmonary vein; RAA, right atrial appendage; RV, right ventricle; RIPV, right inferior PV; RPVs, right pulmonary veins; RSPV, right superior pulmonary vein; NWF, new wavefront.

