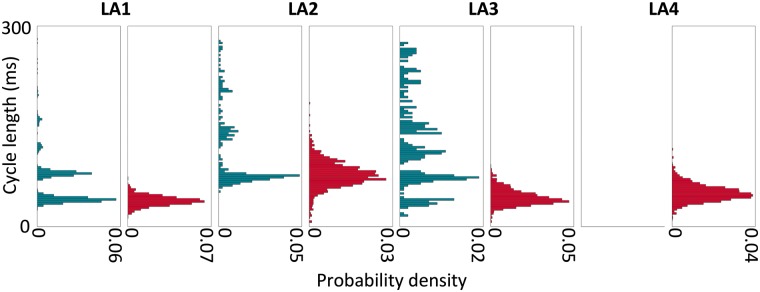
Figure 5.
Probability density histograms show distributions of CLs for the high-density site of new wavefronts and for rotors exhibit differences between preparations. CLs measured during the recordings are displayed as probability density histograms, with teal histograms showing new wavefront CLs and red histograms showing rotor CLs. For LA4, there were no preferential sites of new wavefront initiations, so only the distribution of rotor CLs is considered. CL, cycle length.

