Figure 8.
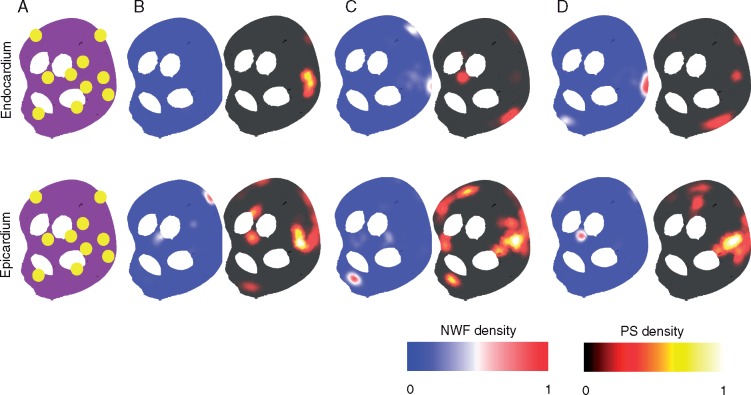
A small number of preferential sites for new wavefronts are observed in simulations with a larger number of connection points. (A) Ten randomly generated connection locations shown in yellow. (B) Set-up with epicardial fibrosis, identical acetylcholine islands, and an APD gradient between surfaces. The APD gradient between the surfaces means that no new wavefronts are seen on the endocardial surface. A single preferential site of new wavefronts can be seen on the epicardium. (C) Set-up with epicardial fibrosis, identical acetylcholine islands, and no APD gradient between surfaces. The removal of the APD gradient means breakthrough occurs on both surfaces. There is more complicated conduction on the epicardium than endocardium due to the epicardial fibrosis, leading to more areas of high PS density. (D) Set-up with epicardial fibrosis, identical acetylcholine islands with increased endocardial acetylcholine concentration, and no APD gradient between surfaces. PS density maps are similar to C, but preferential sites of breakthrough are in different locations. These sites are different for the endocardium and epicardium. APD, action potential duration; PS, phase singularity; NWF, new wavefront.

