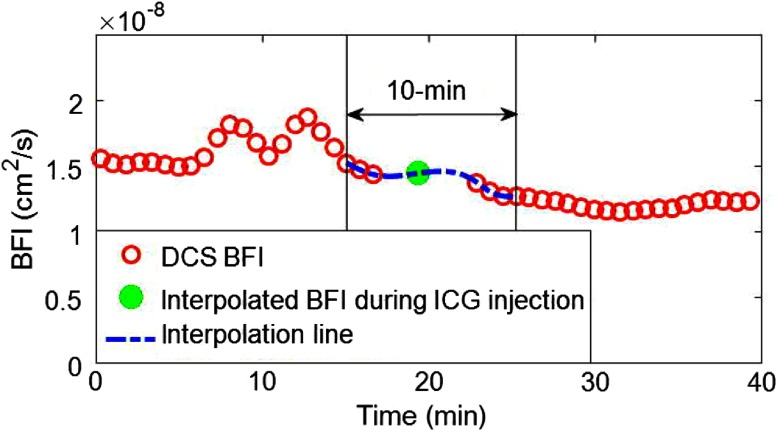
Fig. 2.
An example showing the use of spline interpolation to estimate , i.e., the BFI at the time of ICG bolus injection. The red circles are continuously measured BFIs prior to and after the ICG injection. The dashed blue line is calculated by spline interpolation of the BFIs measured with DCS across the 10-min interval starting 5 min before the injection. The filled green circle is the interpolated BFI at the ICG bolus injection time.

