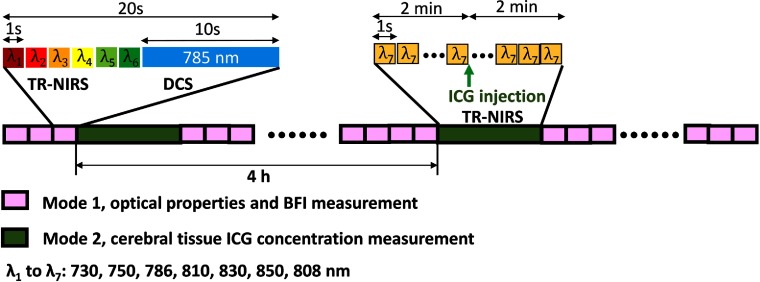
Fig. 4.
Schematic of monitoring protocol (Sec. 2.4). During each monitoring day, TR-NIRS and DCS continuously measured tissue optical properties ( and ) and BFI (pink boxes, instrument mode 1). For the absolute CBF measurement via ICG bolus injection, continuous single-wavelength (808 nm) TR-NIRS measurements were made to track the kinetics of the ICG bolus through the TR-NIRS sampled cerebral tissue (green boxes, instrument mode 2).

