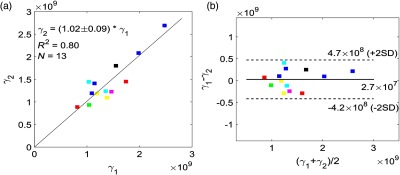
Fig. 6.

(a) DCS calibration coefficients [unit: (]from first ICG bolus injection (horizontal axis) and second injection (vertical axis) across monitoring days in 7 patients. Bolus injections are 4 h apart. The black line represents the best linear fit to the data with the intercept forced to be zero (, ). (b) Bland–Altman plot of the difference in calibration coefficients from two ICG injections versus the mean of the two coefficients. The solid horizontal line indicates the mean difference between the two parameters computed across the study population, which is not significantly different from zero ( with Wilcoxon rank sum test). The dotted line indicates 95% CI limits for agreement. Different colors in (a) and (b) represent different patients.
