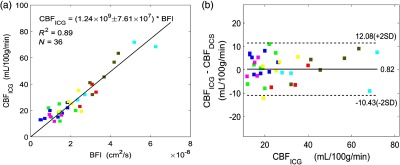
Fig. 7.

(a) Absolute BF measured by DCE-NIRS technique (vertical axis) compared with the BFI measured with DCS (horizontal axis) across measurements. The black line represents the best linear fit to the data with the intercept forced to be zero (, , with F-test). (b) Bland–Altman plot of the difference in absolute CBF measurements from DCS and DCE-NIRS techniques. The solid horizontal line indicates the mean difference between the two parameters computed across the study population, which is not significantly different from zero ( with Wilcoxon rank sum test). The dotted line indicates 95% CI limits for agreement. Different colors in (a) and (b) represent different patients.
