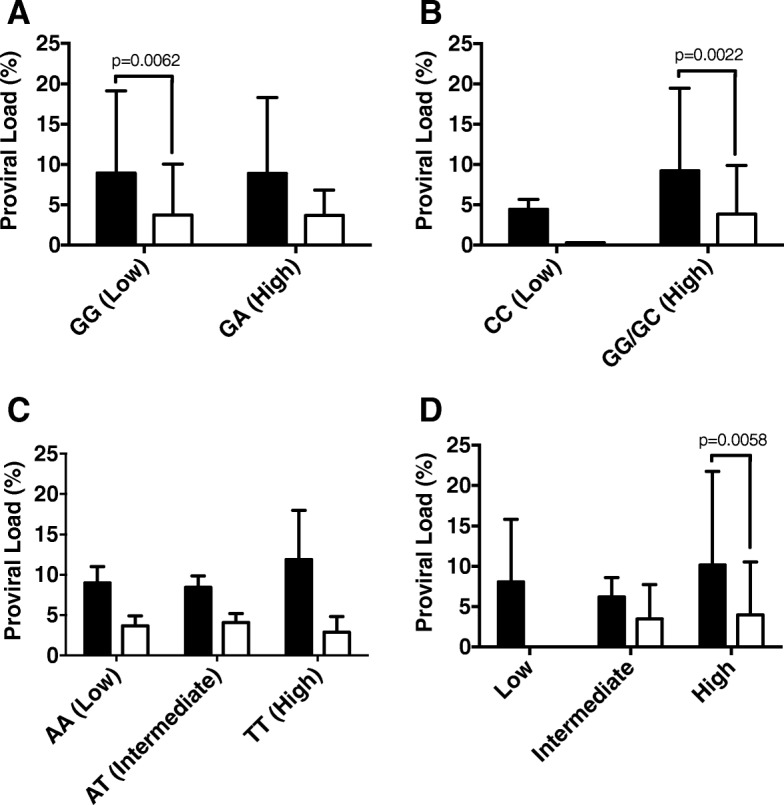
Fig. 1.

HTLV-1 pro viral load according with cytokines genotypes and phenotypes in HAM/TSP versus AC. The proviral load was expressed as percentage of infected blood leukocytes. a, b and c represent TNFA-308G/C, IL6-174GC genotypes and d represent TGFB1 phenotypes. Statistical significances are indicated according with p value
