
Figure 2.
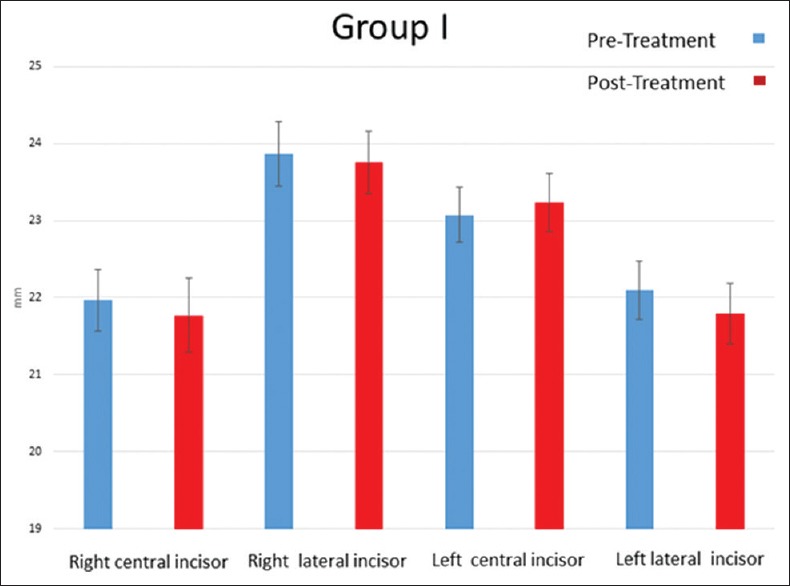
Bar chart showing the average pre- and post-treatment teeth length changes in millimeter as shown in the cone beam computed tomography in the high-frequency mechanical vibration group. Error bars represent standard error of the mean. High-frequency mechanical vibration group. No statistically significant change in tooth length, post-treatment versus pre-treatment. Error bars represent standard deviation