. 2018 Oct 18;10(43):20366–20376. doi: 10.1039/c8nr04048f

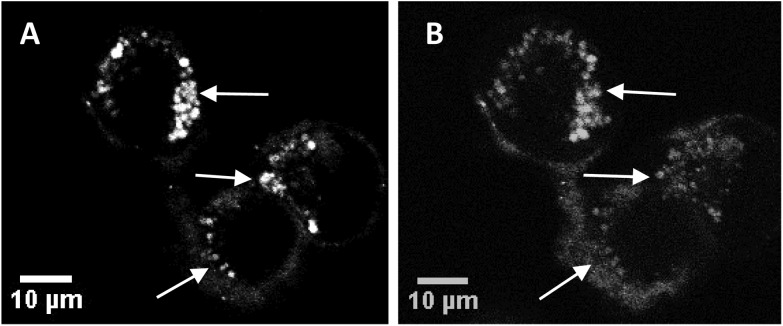
Fig. 3. Cellular uptake and photo-induced redistribution of saporin–Alexa Fluor 488 liposomal conjugate in MC28 cells (A) before light illumination, (B) after light illumination using 405 nm laser for the excitation. Middle arrow highlights an area where the Alexa Fluor fluorescence is initially punctate (A) and transitions to a more diffuse distribution (B); top and bottom arrows highlight bright spots of fluorescence that are absent after illumination due to dilution of the fluorescence. Each figure is from the same field and confocal plane. Scale bar: 10 μm. Light illumination on-stage was effected for 60 s and the image was recorded after a further 60 s delay.

Fig. 3