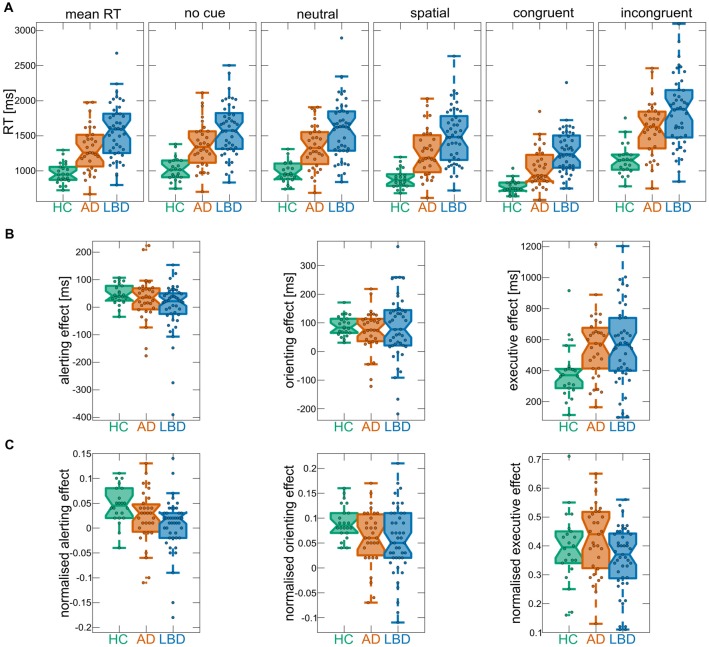
Figure 2.
(A) Mean reaction times (RTs) overall and for the different cue and target conditions of the ANT within each group. (B) ANT effects from raw RTs. (C) ANT effects from normalized RTs. In each boxplot the central line corresponds to the sample median, the upper and lower border of the box represent the 25th and 75th percentile, respectively, and the length of the whiskers is 1.5 times the interquartile range. Corresponding results from statistical comparisons between the three groups are presented in Table 3. AD, Alzheimer’s disease; HCs, healthy controls; LBD, Lewy body dementia.

