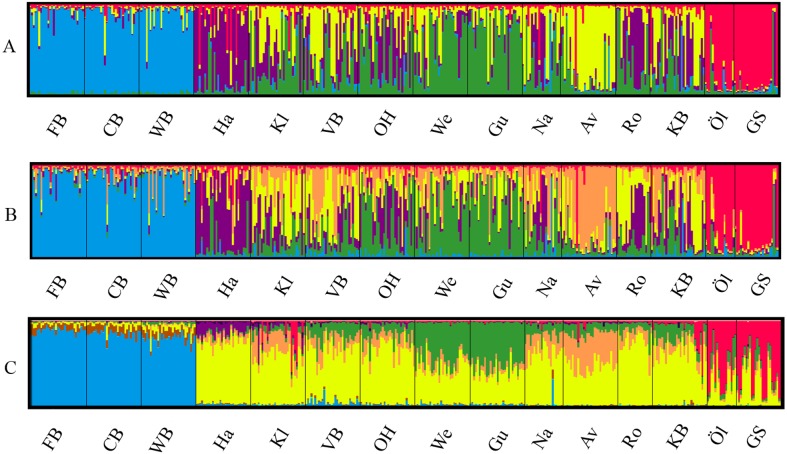
Figure 1. Lumpfish genetic structure.
Lumpfish genetic structuring according to (A) STRUCTURESELECTOR with MedMedK and MedMeanK, K = 5, (B) STRUCTURESELECTOR with MaxMedK and MaxMeanK, K = 6, and (C) TESS with Kmax = 10 based on lowest mean DIC value. Each bar represents one individual with colours indicating probability of belonging to different genetically distinct groups.

