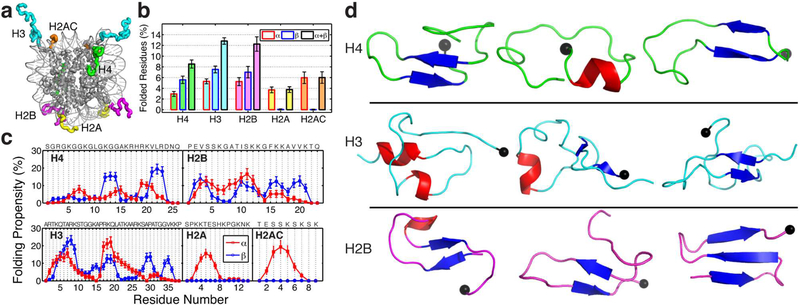
Figure 2. Transient secondary structure populations in the wild-type histone tails.
(a) Illustration of histone tails (H4 in green, H3 in blue, H2B in magenta, H2A in yellow, and H2AC in orange) extending out of the nucleosome surface (PDB 1KX5). (b) Ensemble average and standard deviation (SD) of the percentage of residues in each of the different histone tails calculated from the last 400 ns of the 300 K REMD trajectory (SD computed by block average using 40 ns windows). The percentages of residues forming α-helices (red exterior line), β-strands (blue exterior line), and their sum (black exterior line) are shown separately. (c) Folding propensity i.e. fraction of configurations that each residue adopts α-helical (red) or β-strand (blue) structural motifs. The sequence for each tail is shown. (d) Illustration of cluster with the highest population with folded residues for H4 (first cluster with 12.54% population, ninth with 2.49%, and eleventh with 2.00%), H3 (first with 4.15%, third with 3.77%, and fourth with 3.75%), and H2B (second with 9.08%, fifth with 3.08%, and %, and sixth with 2.00%). The α-Helical motifs are coloured in red, while beta conformations are in blue. The black sphere indicates the last residue of the N-tail (point of attachment to the nucleosome).

