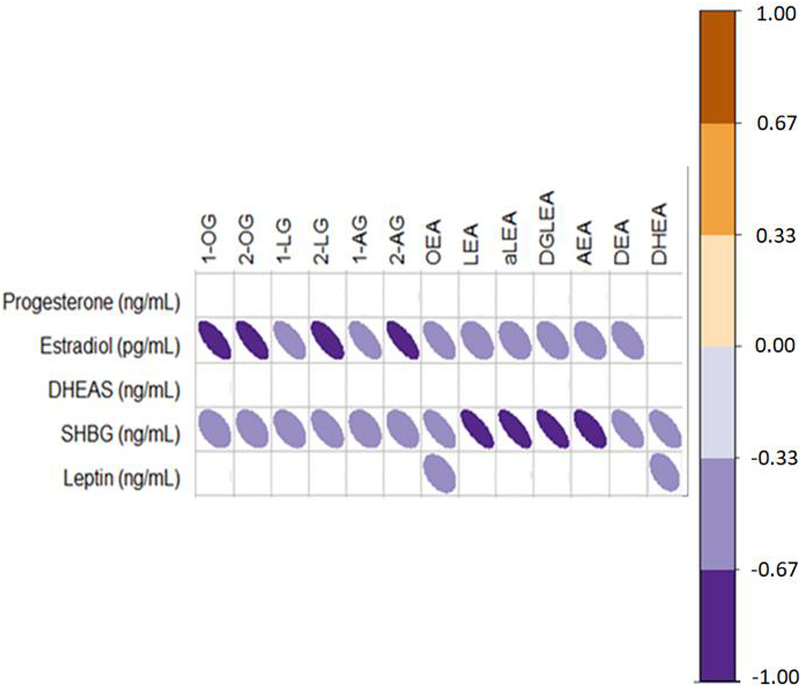
Figure 1:
The Spearman’s rank correlation analyses irrespective of phase for hormones and endocannabinoids (i.e. using data from both phases) are presented. The color scale orange and purple are used to indicate positive and inverse associations respectively that show a trend (0.1>p>0.05, rho: (+/−) 0.29–0.33) or are significant (p<0.05, rho: > (+/−) 0.34) in an n = 17 women.

