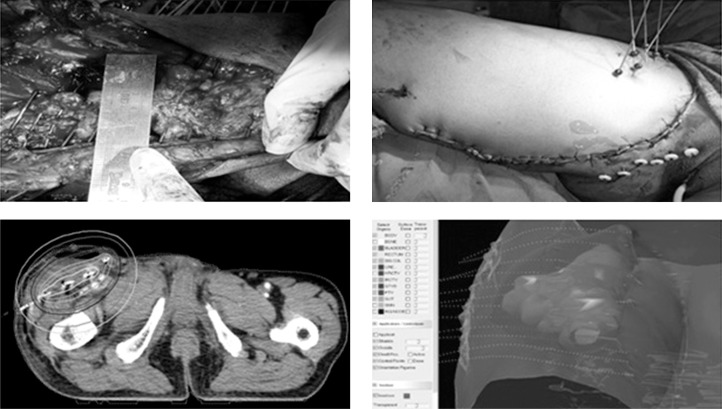
Fig. 1.
ISBT process (steps are depicted sequentially from upper left, upper right lower left, and lower right figure). Upper left figure demonstrates per operative catheter placement in tumor bed maintaining parallelism equidistantly. Upper right figure shows the site after closure of wound with the BT catheters in situ. Lower right figure shows two dimensional isodose distribution. Lower left figure shows three dimensional isodose distribution with respect to reconstructed catheters and CTV

