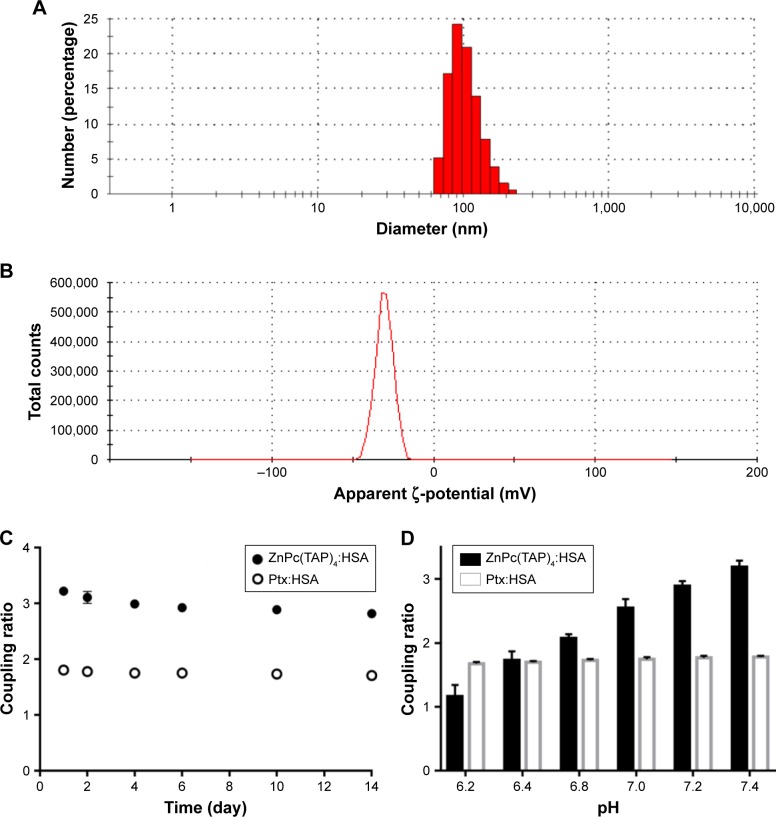
Figure 2.
Characterization of NP–ZnPc(TAP)4–Ptx.
Notes: (A) Particle size of NP–ZnPc(TAP)4–Ptx detected using DLS: average 107 nm. (B) The ζ-potential was measured by DLS: average –28 mV. The coupling ratio was defined by the ratio of ZnPc(TAP)4 concentration, Ptx concentration, and HSA concentration in the complex NP–ZnPc(TAP)4–Ptx. (C) NP–ZnPc(TAP)4–Ptx was stored in PBS with pH 7.4 for 14 days. Coupling ratios of ZnPc(TAP)4:HSA and Ptx:HSA barely changed, which showed the stability of the complex. (D) The coupling ratio of Ptx:HSA was almost unchanged at any pH. The reduced coupling ratio of ZnPc(TAP)4:HSA followed by pH decrease showed that ZnPc(TAP)4 molecules had escaped from HSA NPs.
Abbreviations: ZnPc, zinc phthalocyanine; DLS, dynamic light scattering; Ptx, paclitaxel; HSA, human serum albumin.

