
FIGURE 4.
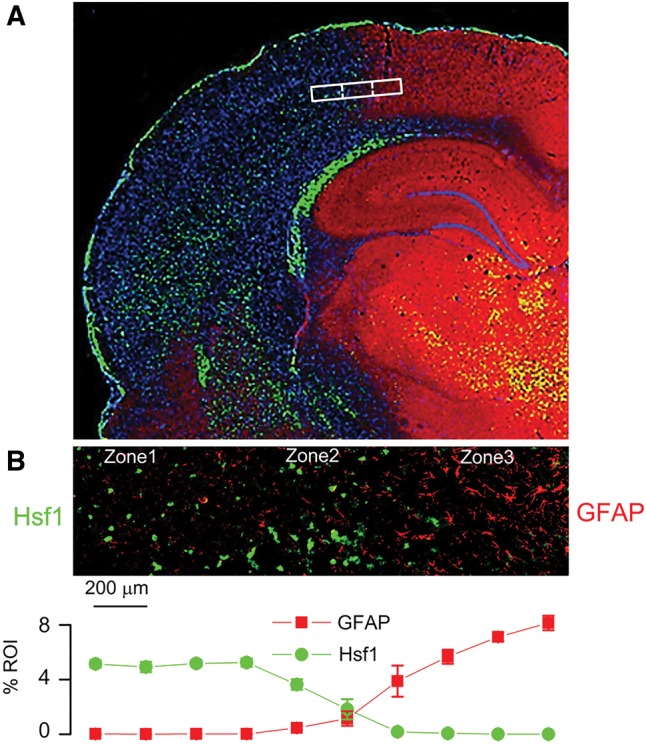
Inverse expression of HSF1 and GFAP across the ischemic gradient, with localization of the ischemic penumbra. Montage of high-power images in rat showing distinct molecular zones defined by GFAP and HSF1 immunolabeling, with Zone 1, a GFAP–/HSF1+ region representing the ischemic core; Zone 2, a GFAP+/HSF1+ area of transition; and Zone 3, a GFAP+/HSF1– area adjacent to normal tissue (A). High-power image of transition zone, with quantification of GFAP and HSF1 labeling in 10 adjacent high-power fields (40×), from left to right across the ischemic gradient (B); mean ±SE; n = 6 brains; original magnification, 20× (A) or 40× (B); GFAP, red/CY3; HSF1, green/FITC; nuclei, blue/DAPI. Images shown are from specimens 24 hours after ischemia/reperfusion.