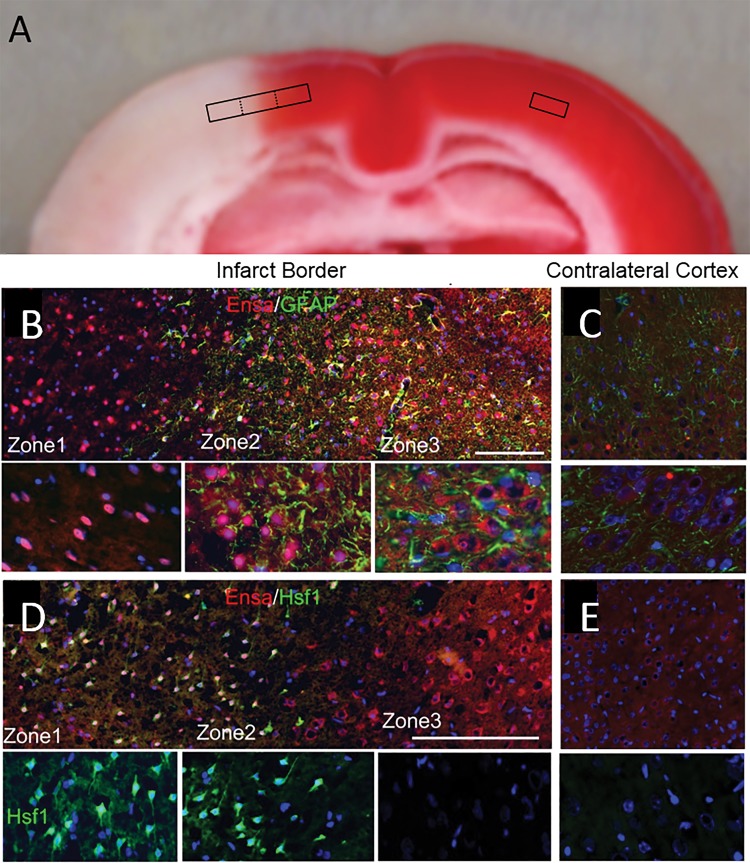
FIGURE 5.
αEnsa protein is differentially expressed in distinct zones of ischemic rat brain. Triphenyltetrazolium chloride (TTC)-stained coronal section of rat tMCAo, with depiction of distinct boxed zones (A). Immunofluorescent montage images of ischemic rat cortex reveal qualitative differences in αEnsa protein expression in distinct regions of ischemic cortex (B, D), relative to controls (C, E); original magnification, 20× (B–E, upper panels); 40× (B–E, lower panels); scale bars, 100 µm (upper panels); 10 µm (lower panels); αEnsa, red/CY3; GFAP and HSF1, green/FITC; nuclei, blue/DAPI. Images shown are from specimen 24 hours after ischemia/reperfusion.

