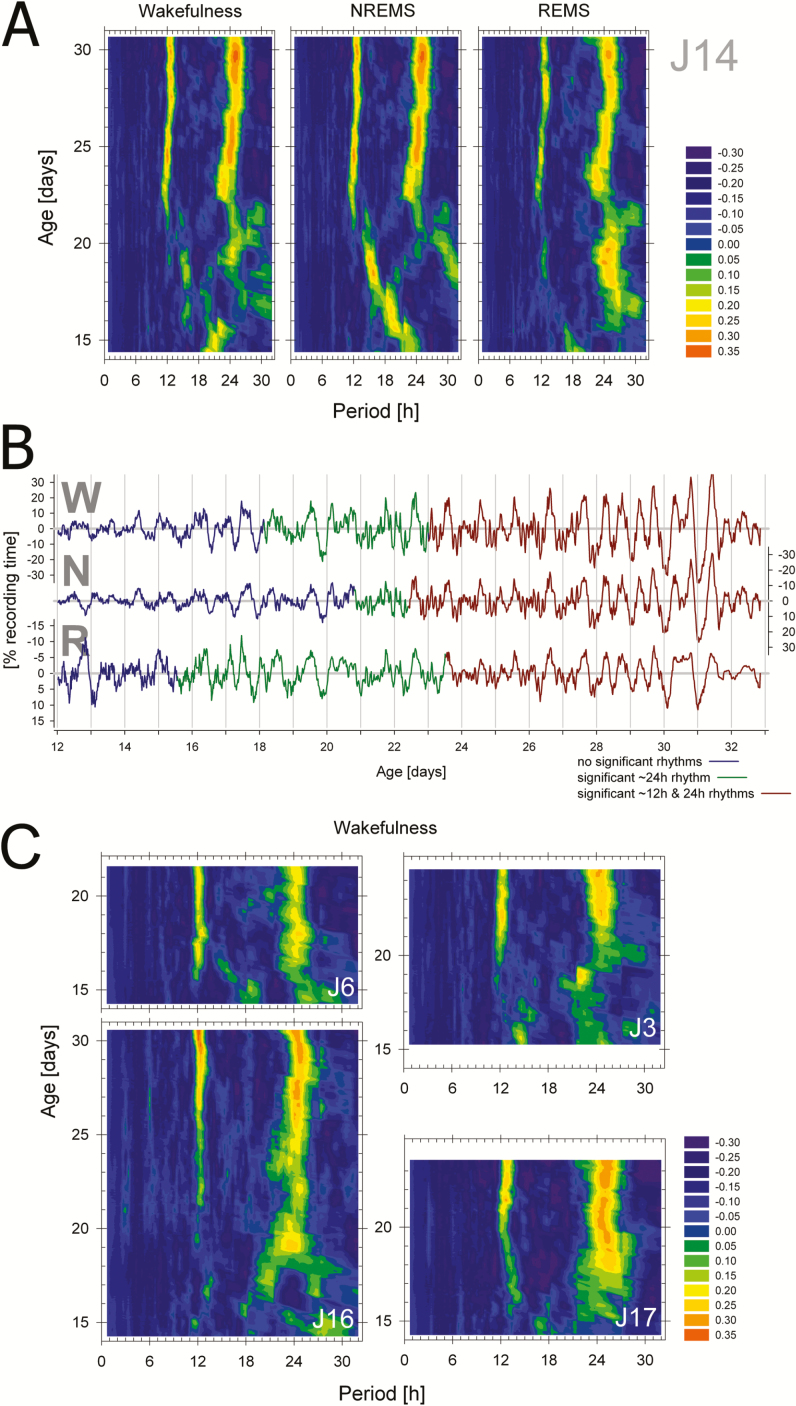
Figure 2.
Appearance of ~12- and 24-hour rhythmicity in the distribution of wakefulness, NREMS, and REMS. (A) Heat maps of periodograms obtained at 20-minute increments for consecutive 4.5-day windows illustrated for one individual rat (J14). Color coded values represent relative Q-values of the periodogram calculated as the difference from the level of Q at p = .01 (see Supplementary Figure 1). Thus green through orange hues represent test periods of significant signal. Note the significant activity in rhythmicity in the 12- and 24-hour ranges starting around postnatal day (P)22 and between P15 and P21, respectively, varying according to behavioral state. Note that the first periodogram that could be calculated was at P14.25; that is, the midpoint of the first 4.5-day window (P12–P16.5). (B) Illustration of the precise onset times of significant 24- (blue-to-green) and 12-hour (green-to-brown) rhythmicity in the original de-trended recordings for wakefulness (W), NREMS (N), and REMS (R) for rat J14. Note that scaling for sleep is inverted to match the wakefulness signal. Note also the presence of a distinct 12-hour component in the sleep–wake distribution especially clear between P27 and P30. Finally, onset times are plotted at midpoint of the 4.5-day sliding window and thus rhythmicity can already be observed in the 2 days prior to onset although a statistical evaluation requires more than two cycles. (C) Periodogram heat maps for the distribution of wakefulness for the four other rats (J3, J6, J16, and J17) with sufficiently long recordings for the detection of stable (>3 days) and significant rhythmicity. Subsequent analyses on appearance of rhythmicity were based on these five animals (see Figure 3 and Table 1). NREMS = non-rapid-eye movement sleep; REMS = rapid-eye movement sleep.

