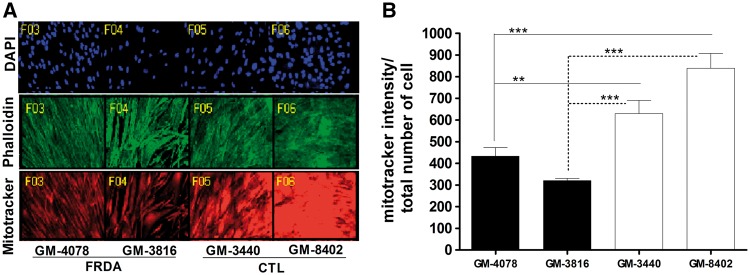
Figure 1.
There is decrease in mitochondrial mass in FRDA fibroblast cell model. Human fibroblast cells were cultured in 96 well plate and stained with DAPI, phalloidin and mitotracker deep red FM. (A) Representative Image obtained from MetaXpress® Hi-content image acquisition, Molecular Devices. (B) Amount of mitochondrial mass measured as mitotracker intensity per cell. Bars represent averages ± standard deviations (n = 8, *P < 0.05, **P < 0.01, ***P < 0.001).

