Figure 2.
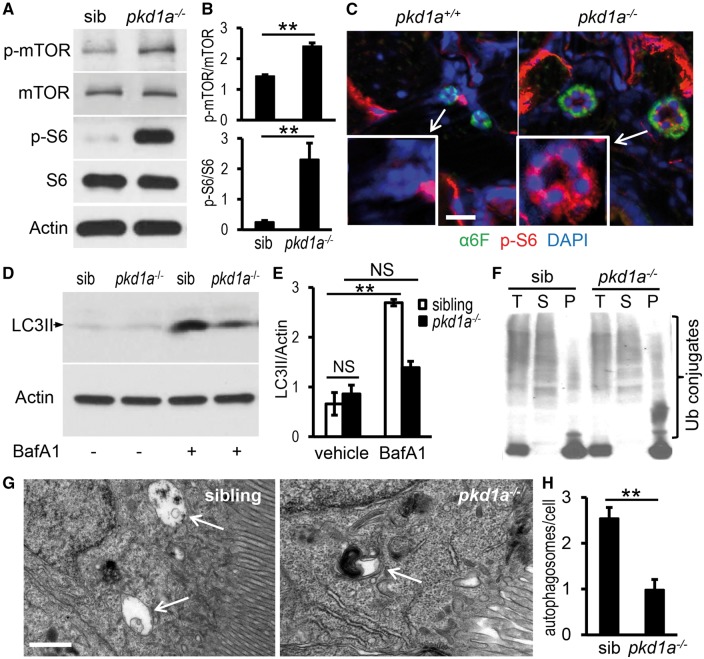
pkd1a-/- mutants show aberrant mTOR activation and dysfunctional autophagy. (A,B) Phospho-mTOR and -S6 proteins were increased in pkd1a-/- embryos. Embryo lysates from day 5 animals were analysed by Western blotting (A). The intensity of phospho-mTOR and -S6 bands was quantified and presented as means ± s.d. (B) (C) Phospho-S6 was specifically induced in the pronephric tubules of the pkd1a-/- embryos. Frozen sections of day 5 animals were immunostained using phospho-S6 ribosomal protein (red) and Na+/K+ ATPase (α6F, green) antibodies. Blue: DAPI. Scale bar: 20 μm. (D,E) LC3II levels in the pkd1a-/- embryos were not increased as effectively as those in siblings in response to BafA1 treatment. Embryo lysates from day 5 fish treated with vehicle or 167 nM BafA1 for 16 h were subjected to Western blot analysis. Actin was used as a loading control. The gel is representative of three independent experiments (D). The intensity of LC3II bands was quantified and presented as means ± s.d. (E). (F) Ubiquitin (Ub)-conjugated proteins were moderately increased in detergent-insoluble fractions of pkd1a-/- embryo lysates. The pkd1a-/- fish and siblings at 5 dpf were subjected to cell fractionation, and the resulting total lysates (T), soluble fractions (S), and insoluble fractions (P) analysed by Western blot using an Ub antibody. The blot is representative of three independent experiments. (G,H) Autophagosomes (arrows) in the pronephric cells of 5 dpf fish were evaluated by electron microscopy in the presence of BafA1. Shown are representative images (G) and quantification of autophagosome numbers per cell (H). A total of 100 cells from three embryos per group were scored. Scale bar: 1 μm. **: P < 0.01. NS: not statistically significant (P > 0.05).

