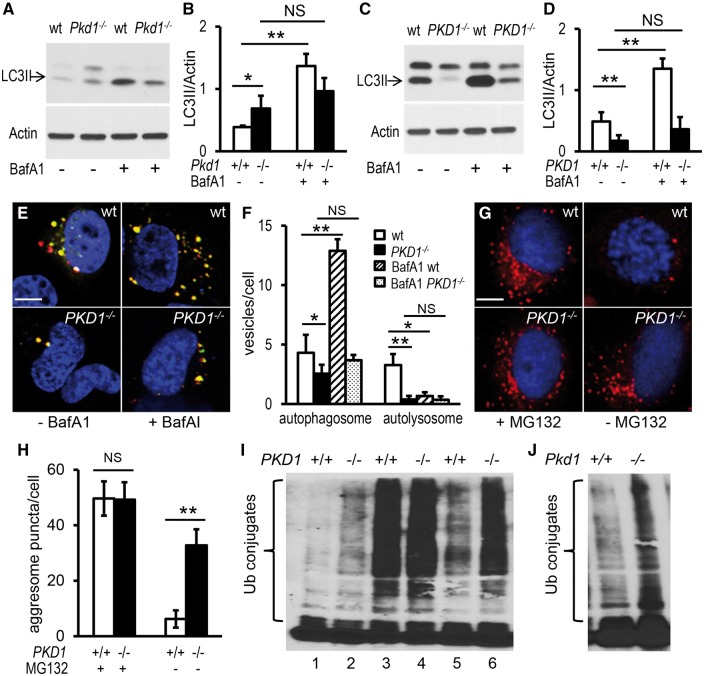
Figure 3.
Autophagy is dysregulated in mammalian PKD1-null kidney epithelial cells. (A,B) Kidney epithelial cells derived from Pkd1-null mouse embryos (Pkd1-/-) had higher basal LC3II levels but failed to significantly further increase LC3II expression after BafA1 treatment, compared with cells obtained from wild-type (wt) mouse embryos. (C,D) 9-12 cells isolated from ADPKD patients (PKD1-/-) had a lower LC3II expression before and after BafA1 treatment, compared with RCTE cells extracted from normal renal cortical tubular epithelia (wt). Cells were grown on plates for 24 h, incubated with 167 nM BafA1 or vehicle for 2 h, and then collected for LC3II analysis by Western blot (A,C) and normalization by Actin expression (B,D). (E,F) Human PKD1-/- cells contained fewer autophagosomes and autolysosomes, compared with wt cells. Cells were transfected with pBABE-puro mCherry-EGFP-LC3B plasmid and collected 24 h later for confocal microscopy imaging. Yellow puncta indicate autophagosomes and red dots indicate autolysosomes (E). Numbers of autophagosomes and autolysosomes per cell are quantified (F). (G,H) Human PKD1-/- cells accumulated more aggresomes, compared with wt cells. Cells were incubated with MG132 for 13 h to induce protein aggregation (left panels) and then returned to the normal growth condition for 11 h to allow clearance of the aggregates (right panels). Aggresomes (red) were detected using the ProteoStat Aggresome Detection Kit (G) and quantified (H). (I) Ub-conjugated proteins were accumulated in the detergent-insoluble fraction of human PKD1-/- cells. Cells were collected in the absence (lanes 1 and 2) or presence (lanes 3 and 4) of MG132 for 13 h, or 11 h after removal of MG132 (lanes 5 and 6). Insoluble fractions of cell lysates were subjected to Western blot analysis using an Ub antibody. (J) Ub-conjugated proteins were accumulated in detergent-insoluble fractions of mouse Pkd1-/- cells. The gel is representative of six (A,C) or three (I,J) independent experiments. Data are presented as means ± s.d. from six independent experiments (B,D) or from approximately 50-100 cells per group (F,H). *: P < 0.05. **: P < 0.01. NS: not statistically significant (P > 0.05). Blue: DAPI (E,G).

