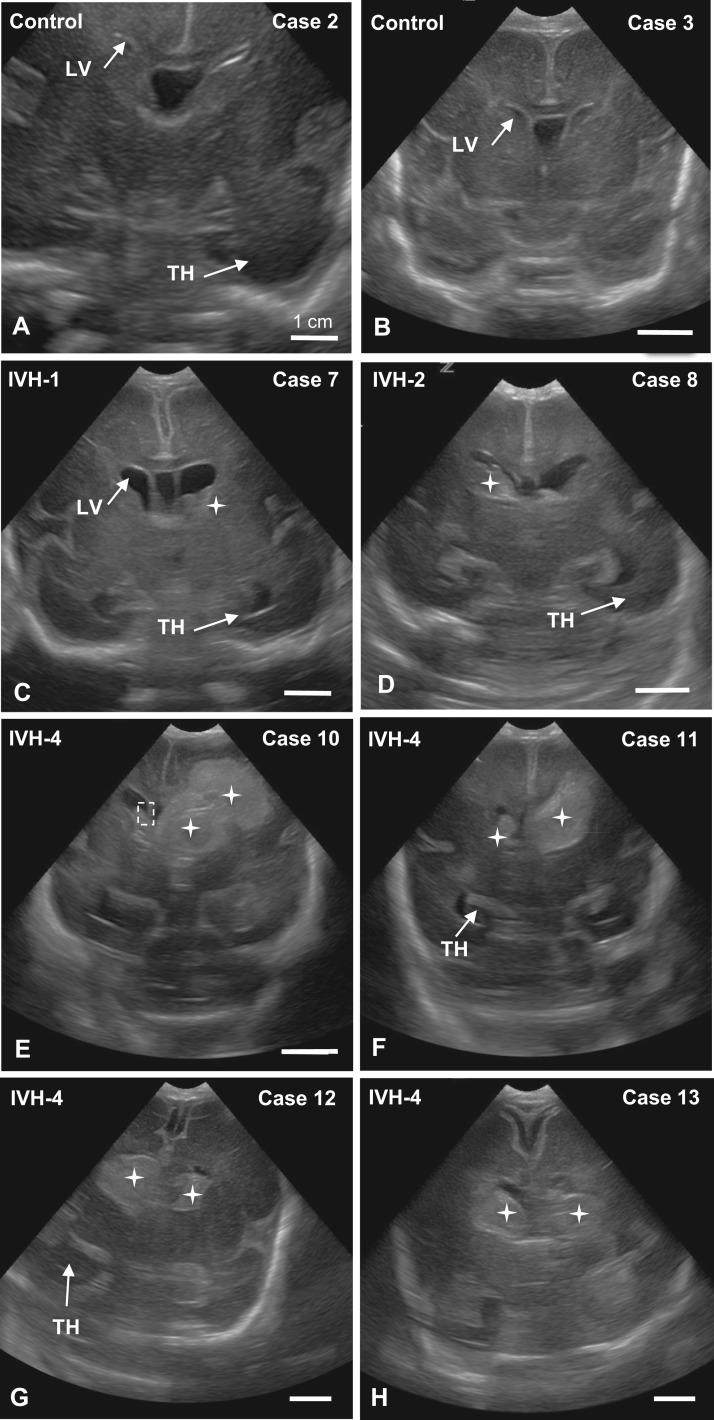
FIGURE 1.
US images of coronal sections showing the appearance of normal LVs in control infants (A, B) and preterm infants with IVH grades 1 (C), 2 (D), and 4 (E–H). Hemorrhages are outlined or identified by stars; the dashed-line rectangle in E delineates the region shown in Supplementary Data Figure S2A–F’. Scale bars = 1 cm.

