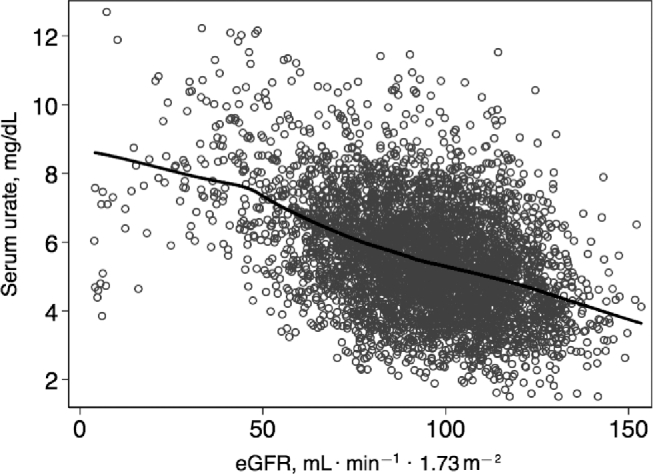
FIGURE 1.

Scatterplot of kidney function (eGFR) and serum urate concentrations in African-American adults (n = 4576). The solid line represents the lowess curve for eGFR and serum urate concentration. eGFR, estimated glomerular filtration rate; lowess, locally weighted scatterplot smoothing.
