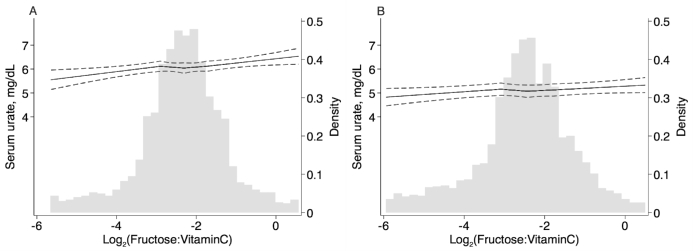
FIGURE 2.
Restricted cubic spline of serum urate concentration by fructose:vitamin C intake ratio among men (A) (n = 1620) and women (B) (n = 2956). The solid lines represent the restricted cubic spline of serum urate concentration by fructose:vitamin C intake ratio, with knots at the 25th, 50th, and 75th percentiles. Fructose:vitamin C intake ratios were truncated at the 1st and 99th percentiles. Dashed lines represent 95% CIs. The gray-shaded histogram represents the distribution of the fructose:vitamin C intake ratio. Regression models were adjusted for age, smoking status, waist circumference, systolic blood pressure, estimated glomerular filtration rate, medication use (diuretic medication, vitamin C supplement), and dietary factors (total energy, alcohol, and animal protein intakes).

