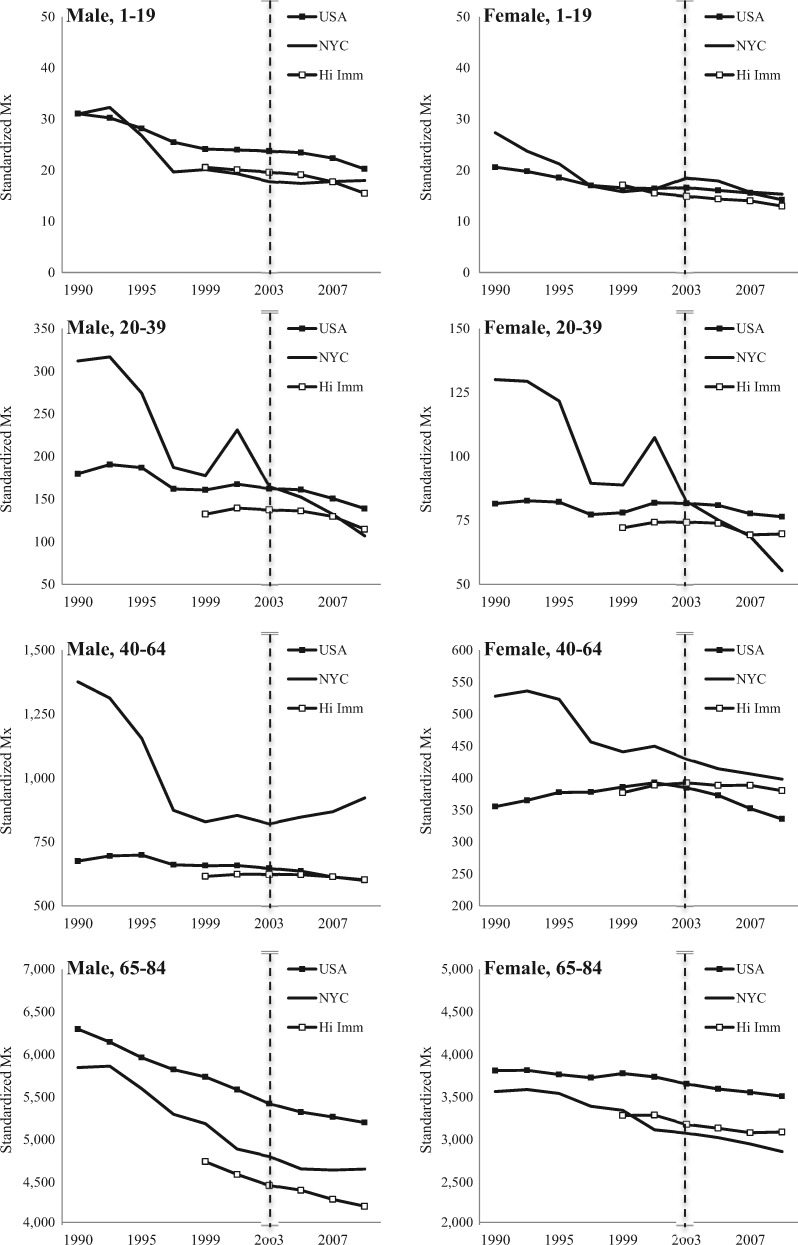
Figure 1.
Period-based variation in all-cause age-specific mortality rates in New York City, the US population and US cities with large foreign-born populations (‘Hi Imm’), 1990-2010. National Vital Statistics Survey System and New York City Department of Health and Mental Hygiene Death Master File. (The Y-axis, ‘Standardized Mx’ refers to the standardized mortality rate per 100 000 persons and the X-axis refers to the year of the analysis).

